👋 Everything about EKS & AI Infrastructure Newsletter "#73" ☁️❤👨💻
Long-context inference gets cheaper, EKS operators get demystified, and the deeper layers keep compounding

Dear EKS & AI Infrastructure enthusiasts,
Welcome to Everything about EKS & AI Infrastructure #73.
There’s a thread running under this edition, and it’s the same one Dhaval Nagar named outside it: the deeper you go in the stack, the harder AI is to disrupt, and the more your work compounds. GLM-5.2’s IndexShare and the Ling-2.6-1T TPU kernel work aren’t flashy — they’re both just making long-context and MoE inference economically survivable in production, which is exactly the kind of unglamorous mechanism that doesn’t show up in a model card but decides whether you can actually ship the thing.
The EKS side of this edition makes the same point a different way. Alexa Griffith’s resource-by-resource teardown of Red Hat AI Inference and Public AI’s sovereign deployment blueprint both answer a question most teams never write down: what does “production-grade” actually cost in YAML, CRDs, and operational surface area, once you stop hand-waving at the architecture diagram? And if you read nothing else this week, read Fatih Arslan’s piece on Kubernetes feedback loops — it’s the explanation for why an operator behaves the way it does that should have existed since day one, not a recap of what you already half-know.
Picking the right substrate is still judgment. Judgment still doesn’t compress.
- Performance Engineering in Modern AI Systems 🌩️
🌩️GLM-5.2 adds IndexShare to cut long-context inference cost
Sparse attention mechanisms like DeepSeek Sparse Attention solve the long-context compute problem by only attending to a top-k subset of tokens, but recomputing that top-k indexer at every layer is itself expensive at 1M-token scale. GLM-5.2 builds on the Multi-head Latent Attention and DeepSeek Sparse Attention inherited from GLM-5/5.1 and DeepSeek V3.2, and adds IndexShare specifically to attack that recurring indexer cost.
The mechanism: instead of running the full top-k indexer on every layer, GLM-5.2 runs it once every four layers and lets the following layers reuse those selected token indices — the attention pattern stays adaptive, but the model stops re-deciding which tokens matter on every single layer. The payoff is concrete: IndexShare reduces per-token FLOPs by 2.9x at 1M context length, which is the difference between 1M-context serving being a cost center and something you can actually run in production. Worth noting this ships alongside an improved MTP layer that increases speculative decoding acceptance length by up to 20%, so the long-context and decode-throughput gains compound rather than trade off against each other.
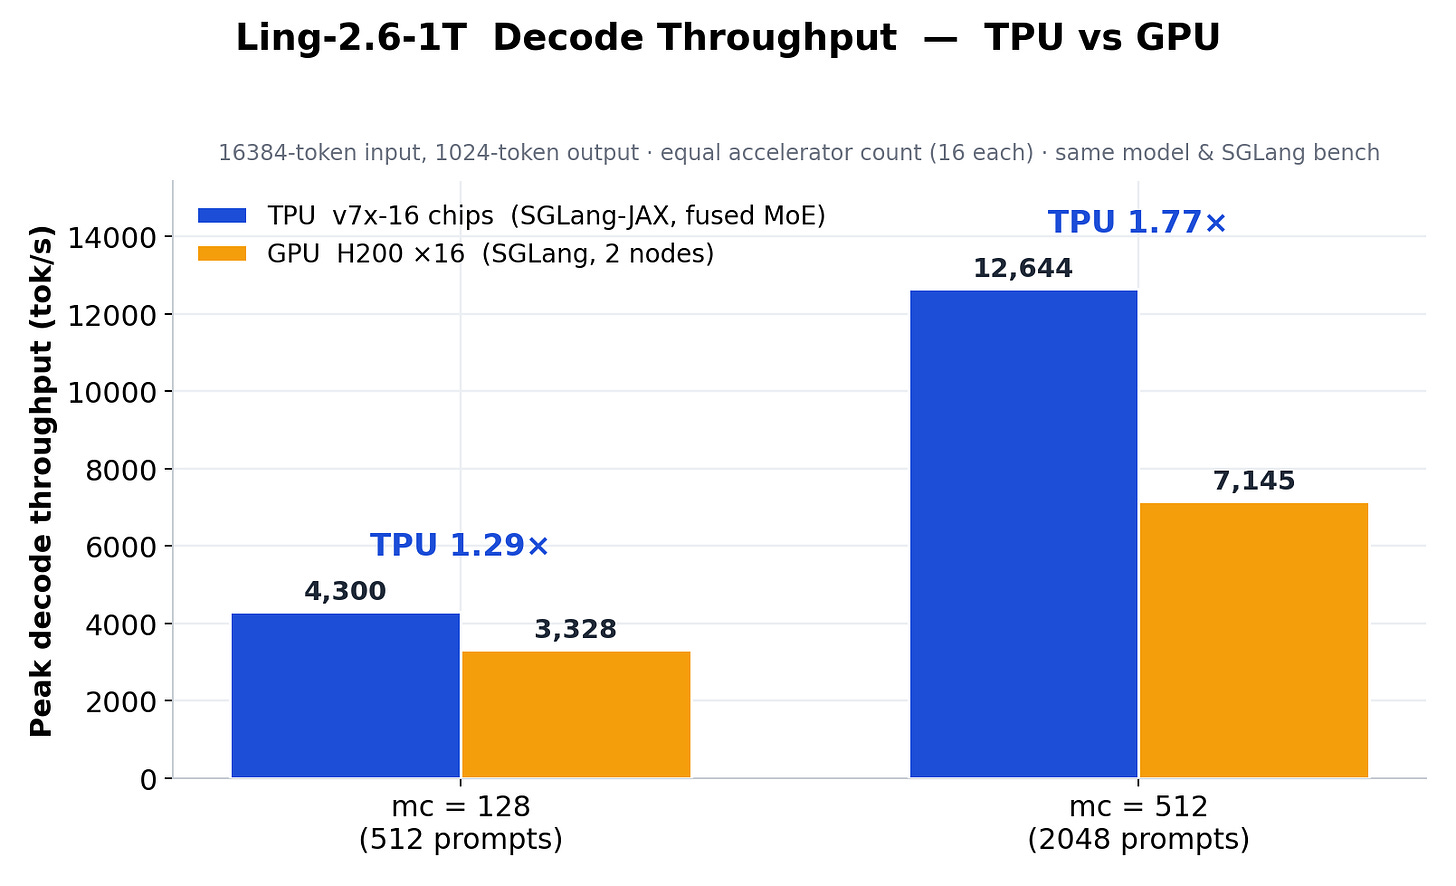
Most people assume MoE inference is slow because of math — lots of expert FFN computation. The LMSYS team’s numbers say otherwise: for inclusionAI’s 1T-parameter Ling-2.6-1T with 256 routed experts on TPU v7x, the actual matrix-multiply work only needs about 0.36ms per device. The production kernel took 5.16ms — 14x longer. The gap is moving tokens between chips and shuffling expert weights in and out of memory, not the matmuls themselves.
Their fix was to stop treating MoE as one big computation and start treating it as a scheduling problem: keep tokens and outputs sitting in fast on-chip memory the whole time, and stream in expert weights in the background while the chip is busy computing. That single change cut prefill latency from 5.16ms to 2.42ms, and let 16 TPU v7x chips beat 16 H200 GPUs on decode throughput by up to 1.77x. The detail worth remembering: even after all that, the slowest part still isn’t the matmul — it’s repackaging numbers into the right format for the chip to read them, which outnumbers actual multiply instructions by more than 10 to 1.
🌩️ Gatekeeper now an optional component in NVIDIA AI Cluster Runtime
GPU clusters fail in boring, expensive ways: a pod requests a GPU but forgets the matching CPU/memory headroom, or a training job’s shared-memory volume is too small and it OOMs an hour into a run. AICR’s recipe system already generates reproducible cluster configs spanning hundreds of values per training/inference target, but reproducible config doesn’t stop someone from submitting a bad pod spec after the cluster’s already up — that’s the gap Gatekeeper’s admission-time policy enforcement closes.
The four controls worth knowing: GPU request/limit parity (no pod claims a GPU without a hard limit), enforced CPU/memory minimums per GPU pod, shared-memory validation for training jobs, and max-GPU caps per namespace on multi-tenant clusters. None of these are novel OPA/Gatekeeper patterns on their own, but bundling them as reusable, versioned policies inside AICR’s component catalog means platform teams don’t have to hand-write and maintain their own ConstraintTemplates for every new cluster — they inherit policy alongside the rest of the validated runtime stack.
🌩️ NVIDIA Dynamo ships day-0 MiniMax-M3 recipes across vLLM, SGLang, and TensorRT-LLM
MiniMax-M3 is a serious long-context model — a native multimodal MoE with ~428B total parameters, ~23B activated, and 1M context support via MiniMax Sparse Attention (MSA), which delivers 9x prefill and 15x decode speedups over M2 at 1M context. Dynamo’s release lands per-backend aggregated deployment recipes for vLLM, SGLang, and TensorRT-LLM in both BF16 and MXFP8 variants, plus the unglamorous-but-essential plumbing: a MiniMax-M3 XML tool-call parser wired into Dynamo’s OpenAI-compatible chat-completions surface, and a fix for missing generation_config.json handling so the model actually loads its default settings.
The number worth keeping: deploying MiniMax-M3 with Dynamo on TensorRT-LLM using disaggregated serving — separating prefill and decode across distinct GPUs — delivers a 4x improvement in interactivity at 32k input sequence length on NVIDIA Blackwell, without sacrificing throughput or increasing GPU budget. That’s the core Dynamo value proposition working as advertised on a real frontier model, not a synthetic benchmark. If you’re running vLLM directly instead, the equivalent serve command needs tensor-parallel-size 8, expert parallelism enabled, and model-specific tool-call and reasoning parsers set explicitly — worth copying exactly rather than guessing at flags for a model this new.
🌩️ SkyPilot Sandboxes: run agent code on your own Kubernetes, at scale
If you’re training or running AI agents, eventually you have to execute code the model just wrote — and you can’t trust it. It might loop forever, eat memory, or try something sketchy. Most teams solve this by sending that code to a hosted sandbox vendor: pay extra on top of compute you already own, and your code and data leave your cluster. SkyPilot does the same job using pods on the Kubernetes cluster you already run. One cluster handled around 50,000 sandboxes at once across 220 nodes, and by keeping a pool of pods already warmed up and ready, launching a new sandbox is over 50% faster than starting one from scratch.
The head-to-head numbers against Modal (a popular hosted sandbox provider) are clear: getting a sandbox ready and running your first command takes about 1.0 second on SkyPilot versus 1.2 seconds on Modal, and SkyPilot stays more consistent under load. Cost is where it really separates: running 50,000 sandboxes for an hour costs \(4,650 on your own general-purpose machines versus \)19,030 hosted — about 4x cheaper, or up to 10x cheaper on cheaper “burstable” instance types. There’s also a hidden tax hosted vendors can’t avoid: calling Modal’s sandboxes from outside the US is nearly 4x slower, just from the distance the request has to travel. Since your sandboxes run in your own cluster, that tax disappears.
The real-world example in the post: training a code-writing AI by having it generate solutions, running each one in its own disposable sandbox to check if it actually works, and feeding that pass/fail result back as the training signal — at the volume an AI training loop actually needs.
- Starred Content ⭐
⭐ P-EAGLE: Parallel speculative decoding on Amazon SageMaker AI
Speculative decoding speeds up inference by having a small draft model guess several tokens ahead, then having the real model verify them in one shot. The catch with EAGLE-style drafters: the draft model itself still guesses one token at a time, so the deeper you speculate, the more sequential draft steps pile up before you even get to verification — the gains shrink the harder you push.
P-EAGLE removes that bottleneck by having the draft model predict all of its guessed tokens in a single forward pass instead of one-by-one. That breaks the linear relationship between speculation depth and drafter latency — you can speculate deeper without paying more for it. The result: up to 1.69x throughput over EAGLE-3 and roughly 4x over standard decoding, tested on Qwen3-Coder-30B-A3B-Instruct on B200 GPUs with FP8. For teams running inference on EKS: this is now merged into mainline vLLM (v0.16.0), so you get the speedup whether or not you’re on SageMaker. And if you are on SageMaker, JumpStart ships pre-trained P-EAGLE heads for GPT-OSS-120B, GPT-OSS-20B, and Gemma-4-31B-IT — no drafter training, no custom CUDA, just deploy.
⭐Alexa Griffith: Red Hat AI Inference on Amazon EKS — Exploring the Kubernetes resources
Most inference platform docs sell you the YAML; this piece shows you what that YAML actually creates. Alexa deployed Red Hat AI Inference 3.4 on a two-node g6.2xlarge EKS cluster and traced the full resource footprint, landing on seven namespaces, 12 deployments, 13 services, 17 CRDs, and one Gateway instance spread across cert-manager, Istio/Gateway API, KServe, llm-d, LeaderWorkerSet, and a cloud-manager operator — all installed once per cluster as shared infrastructure before a single model gets deployed.
The sharpest detail is the coordination cost KServe is hiding from you: without it, platform teams manually synchronize 200+ lines of YAML per model — deployments, services, HTTPRoute mappings, InferencePool groups, certs, RBAC — and scaling from two replicas to four means manually updating the deployment, reconfiguring InferencePool backends, and adjusting HTTPRoute weights without breaking RBAC. KServe collapses that into a ~30-line LLMInferenceService manifest that it reconciles into all of the above. Also worth knowing: llm-d’s Helm chart only installs CRDs — the actual Endpoint Picker scheduler pods get created per-model, so don’t expect to see llm-d router pods until you’ve actually deployed a model on top of the platform.
One gap worth flagging for anyone planning disaggregated serving: LeaderWorkerSet supports a DisaggregatedSet pattern for separating prefill and decode, but Red Hat AI Inference 3.4 doesn’t include that capability yet — useful to know before you architect around it. Part 2 covers per-model runtime resources and GuideLLM validation, worth tracking as a follow-up.
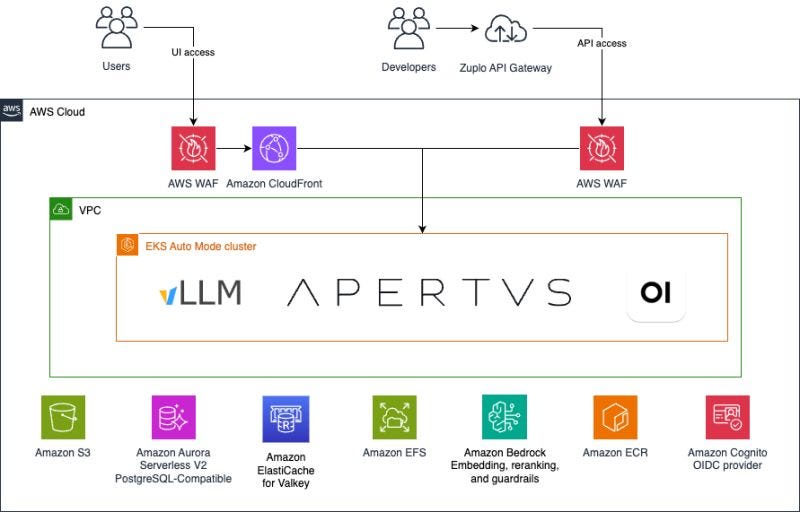
Publishing open model weights doesn’t get you a production inference service — national AI initiatives like Swiss AI, AI Singapore, and Ai2 train and publish models, but none of them operate production inference. Public AI built that missing layer for Switzerland’s Apertus launch, and the EKS architecture decisions are the part worth sitting with. They run a fully containerized stack on EKS Auto Mode — meaning no manual node group management, just declared compute requirements while AWS handles provisioning and scaling underneath the cluster.
The component breakdown matters because it shows what “production-grade” actually requires beyond the model server: CloudFront and AWS WAF front both the chat UI and API gateway, Cognito handles identity for both paths, requests route through a gateway layer to auto-scaling vLLM deployments, and Bedrock Guardrails enforces safety policy inline on every request across both model variants. State and storage are split deliberately rather than dumped into one service: Aurora Serverless v2 for persistent data, ElastiCache for Valkey for caching, S3 for objects, and EFS for sharing files across pods — that EFS detail is the one easy to miss, since shared-file access across pods is a real gap in a lot of stateless-by-default EKS deployments.
The sharpest infra decision, though, is compute placement: the Apertus 8B variant runs on Intel-powered EC2 R8i instances inside the EKS cluster, while the 70B variant runs on GPU-backed nodes, with R8i delivering up to 40% higher inference performance than the prior R7i generation — meaning the cluster isn’t GPU-only by default; node pools are split by model size, with CPU inference doing real production work for the smaller variant rather than serving as a fallback. They built this in AWS Europe (Zurich) to keep inference and user data within Swiss jurisdiction, under deadline pressure since vLLM didn’t support the Apertus architecture until weeks before launch. Since then, the platform has served thousands of active users daily with thousands of concurrent users at peak — this is a cluster topology that’s been load-tested by real traffic, not a paper architecture.
⭐ Jeremy Cowan: eks-cross-region-nodes — stretch EKS clusters across regions and accounts
Normally, an EKS node only knows how to talk to the cluster in its own region — on every reboot, the bootstrap process resets it back to local config. Jeremy’s fix patches the kubelet right before it starts, on every boot, to point it at a cluster living somewhere else entirely: overriding the hostname, the node’s identity, and disabling the cloud controller’s auto-cleanup so it doesn’t delete the “foreign” node.
Cross-account is the harder version of this, since a node in Account A can’t natively see a cluster in Account B. The fix: the node assumes a role in the cluster’s account just to ask “where is this cluster,” then runs a dedicated network DaemonSet using its own account’s identity for everything else.
One gotcha worth knowing if you replicate this: EKS only auto-approves a new node’s security certificate if it’s in the cluster’s home VPC — cross-region nodes get stuck waiting forever, breaking kubectl logs and exec until you add an auto-approver. The project ships a full CLI for registering satellites and autoscaling them, and it’s already on its ninth release — not just a proof of concept.
⭐ Fatih Arslan: The feedback loops behind Kubernetes
“An operator reconciles desired state” is technically true and explains nothing. Fatih (who built one of the first production CSI drivers, now runs database operators at PlanetScale) starts over: run Postgres by hand with docker run and ssh, hit every failure a real cluster hits — disks that vanish on restart, IPs that break replication, config that drifts across nodes — until the only sane fix is a loop that checks every few seconds: does reality match what I want? Turns out that loop is already Kubernetes. The kubelet, scheduler, CSI, and CNI are just versions of that same loop, each one quietly doing its own job.
The one idea worth taking away even if you read nothing else: Kubernetes controllers never ask “what just changed.” An event only tells the controller it’s worth looking again — never what to do. The controller re-reads the current state from scratch every time and decides fresh. That’s the whole reason a controller can crash, restart anywhere, and just pick up where it left off with zero special recovery code — there’s no “memory” to lose, because it never trusted memory in the first place.
If you’ve ever debugged a Kubernetes operator creating duplicate resources out of nowhere, there’s a real bug explained here too: a controller’s reads come from a local cache, but its writes go straight to the live cluster — so if it reconciles again before that cache catches up to its own write, it can think the work still needs doing and do it twice. Good to know before you go looking for a race condition that isn’t there.
- Announcements 📢
📢AWS Summit New York 2026: AgentCore, S3 annotations, and the production-agent infra stack
Getting an agent from prototype to production usually means standing up your own RAG pipeline, your own metadata layer, and your own observability — infra work that has nothing to do with the agent’s actual task. This summit’s announcements target exactly that gap, layer by layer.
Knowledge and retrieval. AgentCore’s new Managed Knowledge Base handles ingestion, parsing, and retrieval with native connectors to S3, SharePoint, Confluence, and Google Drive, with Smart Parsing for automatic multi-format data preparation and an Agentic Retriever for complex multi-step queries, integrated with AgentCore Gateway. Underneath that, S3 annotations let you attach up to 1GB of rich, mutable, queryable context directly to objects, purpose-built for agents that need to discover and act on data without maintaining a separate metadata system. And Web Search on AgentCore gives agents a fully managed tool grounding responses in current, cited web knowledge with zero data egress from your AWS environment — no more bolting on a third-party search API and managing its infra yourself.
Observability and governance. The part most teams are missing today: failure, intent, and trajectory insights across hundreds of agent sessions, with GA recommendations and A/B testing to validate behavior changes. AWS also folded Bedrock Guardrails directly into AgentCore to evaluate every agent action for prompt injection, harmful content, and sensitive data exposure, with detection-signal integrations from Check Point, Zscaler, Rubrik, Netskope, and SentinelOne coming soon — worth tracking if your security stack already includes any of those and you want a unified signal path into agent behavior.
Scale context. AgentCore task volume has grown 15x in six months, so none of this is early-stage tooling — it’s catching up to real production load. If you’re running agents on EKS today and hand-rolling your own retrieval, metadata, or trace-debugging layer, most of what’s described above is a direct alternative to that custom plumbing, not just an incremental feature.
📢Amazon SageMaker AI launches multi-turn reinforcement learning for AI agent customization
Standard RLVR/RLAIF fine-tuning rewards a single response. Agentic tasks aren’t single responses — they’re sequences of decisions across multiple tool calls and turns, and rewarding only the final output misses where the agent actually went wrong along the way. Multi-turn RL closes that gap: it trains models against your own agent environment and rewards the full sequence of decisions an agent makes across a task, aimed at specializing smaller, lower-cost models to match or exceed the task accuracy of larger general-purpose models on your target workload.
The infra angle that matters most: this is serverless, so there’s no custom infrastructure to build — previously a weeks-long effort for multi-step agentic training. If you’re currently rolling your own Ray/PPO loop to fine-tune an agent on its own trajectory data, this is a direct alternative to that build. Available now through SageMaker Studio and the Python SDK, with model support split by region — Qwen 3.6 27B, Nova Lite 2.0, GPT-OSS-20B, and Gemma 31B in us-west-2, versus a narrower Nova Lite 2.0 / GPT-OSS-20B set in us-east-1 — worth checking before committing to a model choice if you’re planning around this.
**
📢**Amazon SageMaker AI adds observability for inference endpoints
Diagnosing inference issues on SageMaker has meant manually correlating CloudWatch metrics — was that latency spike a GPU saturation problem or KV cache exhaustion, and why did autoscaling lag behind it. The new observability layer tracks TTFT, inter-token latency, queue depth, and tokens per second in real-time, surfaced alongside GPU health, inference component placement, and autoscaling behavior in one CloudWatch dashboard, with OpenTelemetry native metrics published automatically — no instrumentation required.
The detail worth knowing if you’re already running Grafana: teams can skip the CloudWatch dashboard entirely and connect via a regional PromQL endpoint with a pre-built dashboard template, so this isn’t a lock-in into AWS-native observability if your team already standardized elsewhere. Available now across 17 regions including Mumbai, Singapore, and Tokyo — worth checking if it’s live in your deployment region before you build the equivalent dashboard yourself.
📢 Amazon EKS local clusters on AWS Outposts now support EC2 instance store
Running EKS local clusters on Outposts used to mean managing the control plane yourself on-site — etcd backups, logging agents, the overhead managed EKS normally hides. That’s gone for instance-store-backed Outposts: EKS now manages the control plane in a service-owned account, while it still runs entirely on the Outpost for data residency and resilience against network disconnects.
The bigger win is feature parity: new Kubernetes and EKS platform versions now ship on the same cadence as cloud EKS, with support for add-ons, IRSA, Pod Identity, OIDC, access entries, and Bottlerocket nodes. One catch — this only applies to instance-store-backed Outposts; EBS-backed racks stay on the older architecture, so worth checking which type you’re running.
Community & Career 🤝
🤝Markian Rybchuk announces Open Inference — TPU-native inference cloud
The core finding: most open models are accidentally GPU-native, and that mismatch costs real throughput on TPU. Rybchuk’s team found gpt-oss-120b’s 64-wide attention heads leave 75% of a TPU’s matrix unit multiplying zeros — the head width was tuned for GPU tensor cores, not TPU’s systolic array shape, so most of the MXU sits idle doing wasted multiplications.
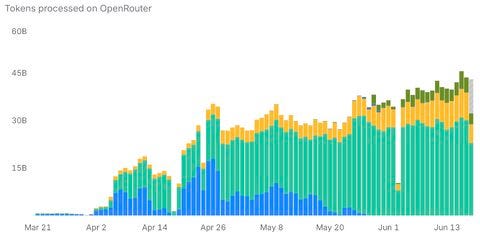
Their fix wasn’t a serving-layer trick, it was changing the model’s attention head geometry directly (”architecture surgery”), which got 2.9x prefill throughput at 128k context, matching H100 performance on a chip that’s more available, with model quality staying within run-to-run variance of baseline across math, science, and long-context benchmarks. The sharper number for anyone chasing long-context latency: sharding a single prompt across a Trillium pod with sequence parallelism drives 131k-token time-to-first-token down to 0.13s — 12x lower than a B200 node, a 25x improvement from single-node to a 256-chip pod. The team also crossed 1T tokens/month on OpenRouter and launched their paid platform at $30k MRR this week, so the throughput numbers aren’t just a benchmark — they’re running in production.
🤝 Manu P Anand fine-tunes Qwen2.5-7B on a single L4 GPU with Unsloth + QLoRA
The default assumption — that fine-tuning a 7B model needs multi-GPU infrastructure — doesn’t hold once 4-bit quantization and LoRA are in the picture. Manu built the full pipeline on a single AWS g6.xlarge (NVIDIA L4, 24GB VRAM): dataset prep in ChatML, QLoRA fine-tuning, and merge/export, skipping pre-built notebooks specifically to understand the mechanics himself.
The numbers worth keeping: 4-bit Qwen2.5-7B loads at 6–8GB, LoRA adapters add another 2GB, and peak VRAM during training hit 18–21GB on a 24GB card — comfortable headroom with gradient checkpointing on. Only 41.9M of 7.6B parameters were trainable (0.55%), and Unsloth delivered roughly 1.9x throughput over a baseline HuggingFace + PEFT setup on identical hardware — a real cost multiplier when you’re paying by the GPU-hour on a rented instance, not just a convenience win. The repo ships the full train_config.yaml, so the lora_r=16 / paged_adamw_8bit / bf16 combination he landed on is directly reusable as a starting config for similar 7B-on-L4 jobs.
🤝 Dhaval Nagar: What AI Isn’t Disrupting
Dhaval’s framing cuts through the “AI is eating software” noise: software runs on layers, and the closer to the surface, the more replaceable by AI right now — the deeper you go, the more specialized and harder to disrupt. UI and glue code sit at the top, getting eaten fast. Architecture and data shape sit in the middle, where AI gives a confident draft but knowing why it’s wrong is still the human job. The bottom layer — storage, specialized databases, custom compute — is where AI doesn’t replace anything, it consumes the output.
He backs this with real recent launches rather than just asserting it: Trainium3 on a 3nm process delivering 2x the compute of Trainium2 at 40% better efficiency, S3 Vectors as a new storage primitive, Redshift zero-ETL into Aurora and RDS, and Graviton5 capacity reportedly pre-reserved by major customers for all of 2026 — alongside Google’s 260 separate announcements at Cloud Next, including managed remote MCP servers for AlloyDB, Bigtable, Cloud SQL, Firestore, and Spanner, explicitly making those databases more agent-accessible rather than replacing them. His closing point lands cleanly for anyone deep in infra: picking the right substrate is judgment, and judgment doesn’t compress — the deeper layer engineer is more valuable this year, not less, precisely because AI now writes the connectors but still needs to be pointed at the right primitive.
- Highlights ✨
✨Amazon ECS service auto scaling now supports 20-second high-resolution metrics
The old default: ECS target tracking evaluated scaling decisions every 60 seconds, so a traffic spike could sit undetected for the better part of a minute before a single new task even started. With 20-second metric resolution and metric publishing optimizations, the full spike-to-running-task window drops from 386 seconds to 109 — meaning you can run a thinner baseline and lean on autoscaling to actually catch up in time, instead of over-provisioning to cover the detection lag. It works identically across Fargate, ECS Managed Instances, and EC2, so this isn’t a Fargate-only perk — anyone on self-managed EC2 capacity gets the same scale-out speed.
Turning it on is a one-line policy change — swap your target tracking metric for ECSServiceAverageCPUUtilizationHighResolution or ECSServiceAverageMemoryUtilizationHighResolution — but it’s not free: high-resolution CloudWatch metrics carry their own cost, while the 60-second default stays free. Worth checking the CloudWatch pricing delta against your task-count before flipping this on fleet-wide, especially on high-cardinality services.
✨Amazon SageMaker AI introduces container caching for new-instance scale-out
Scaling out a SageMaker inference endpoint involves several serial cold-start stages — detect the need, provision the instance, pull the container image, fetch model weights, start the container — and AWS has been picking these off one at a time. This launch closes the image-pull gap specifically for instances that don’t already exist yet: container cache removes image pull when launching new instances, reducing end-to-end scaling latency by up to 50 percent, on top of sub-minute metrics that detect load changes up to 6x faster than standard CloudWatch, and instance-store caching that already removed image-pull and model-download latency when reusing running instances.
The distinction worth keeping straight: this is for new instances joining the fleet, not instances already warm in the pool — that’s what the earlier “data caching on existing instances” piece in the same series covers. Together, the three pieces move SageMaker AI scaling from minutes of cold-start latency to rapid, predictable responses, and it’s worth noting in the post that this activates automatically on supported accelerator instance types with no opt-in — so if you’re already on SageMaker for GenAI inference, you may already be getting this without having changed anything.
✨NVIDIA and AWS: end-to-end Physical AI data pipeline for Autonomous Vehicle 3.0
The pipeline targets what NVIDIA calls AV 3.0: end-to-end reasoning VLA systems that perceive, reason, and act as a unified policy, validated in closed-loop simulation rather than the modular perception-prediction-planning stacks of earlier AV generations. The reference architecture chains NVIDIA Cosmos foundation models, Cosmos Curator, Cosmos Dataset Search, Omniverse NuRec for neural 3D scene reconstruction, and Alpamayo for VLA training across managed AWS infrastructure, covering raw fleet sensor ingestion through video curation, scene reconstruction, model training, and closed-loop simulation. Worth a glance if you’re tracking how NVIDIA’s physical AI stack is landing on cloud infra generally, though it’s outside the Kubernetes/EKS scope most of this newsletter covers.
🎉 Sponsor Section
At the moment, we don’t have a sponsor for this edition, but we look forward to working with companies and organizations that support the EKS & AI Infrastructure community in future editions. If you or your company is interested in sponsoring, please contact us at 📧 thecloudtechforall@gmail.com
📝 Words from the Author
I’ve been thinking about something that feels a little uncomfortable in the middle of an AI moment: some kinds of knowing don’t transfer, no matter how good the model gets at explaining them.
You know how a really experienced person on your team can glance at a problem and immediately know what’s wrong, before anyone else figures it out? They usually can’t fully explain how they knew. AI is genuinely great at the explaining part now — it can write the playbook, walk through the steps, sound like an expert. But it’s built from what’s already been written down. The gut feeling that catches a problem before you’ve consciously reasoned through it doesn’t come from reading the playbook. It comes from living through the trouble enough times that your brain learned to spot it on its own.
That’s the part I don’t think AI shortcuts, even as it gets better at everything around it. It can hand you the steps faster than anyone ever could. It can’t hand you the years that taught someone which step actually matters in this exact moment, today, on this cluster, with this on-call alert. That still has to be lived.
So I’ve stopped expecting AI — or myself, or anyone on my team — to skip that part. The tools get better every month. The instinct still takes the time it takes. I think that’s actually good news, not a complaint. It means the deep stuff doesn’t get cheaper just because everything around it did.
Happy building. 😎


